Those who read Infinity’s CMMD paper should now realize there’s a stiffness hierarchy among various speaker cone materials. The paper talks about measurements of stiffness of these materials (expressed as Young’s Modulus). Speaker cones with a high Young’s Modulus will go into break-up at higher frequencies than more flexible cones. This wider pass band makes it easier for a crossover to prevent a listener from hearing a speaker cone in break-up mode.
This stiffness hierarchy translates into a hierarchy of frequencies at which speaker cones go into break-up mode. The CMMD paper talks about “First Cone-Bending Mode”. Table 2 (summarized below) shows “the frequency of the first natural cone-bending mode for the entire moving assembly of a 5¼" driver for each of six different cone materials attached to a typical voice coil and surround.”
Cone Material – Frequency (Hz) of First Cone-Bending Mode
Polypropylene (1500 Hz)
Kevlar (1920 Hz)
Paper (2160 Hz)
Aluminum (6700 Hz)
Titanium (7440 Hz)
Ceramic (10800 Hz)
CMMD (10190 Hz)
From that table, I believe “first cone-bending mode” translates into the frequency at which a speaker’s begins to go into break-up mode. However, it’s clear that the frequency of first cone-bending mode of a cone material is different from the frequency at which a driver goes into break-up. The size of the drivers plays a role. So does the composition of a speaker’s frame, surround, and spider. So, let’s keep the driver sizes the same and compare driver’s made by one company, SEAS, to minimize the effects of frame, surround, and spider composition to try to extend this comparison. My goal is to directly show that cone material has a direct effect of widening a speaker’s pass band by moving the break-up peaks to higher frequencies.
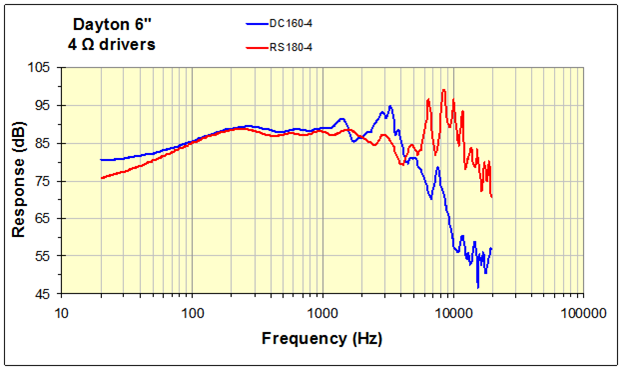
A few years ago, I put together this graph comparing the frequency responses of 2 Dayton 6” drivers, one with a paper cone (DC 160-4, blue trace) and the other with an anodized aluminum cone (RS 180-4, red trace). The driver sizes weren’t identical, and the frame, surround, and spider materials may not have been the same, but putting both frequency responses together showed exactly what I’m after. Both drivers had similar looking curves as long as they were not breaking up. The paper driver goes into break-up possibly as low as 1500 Hz, certainly by 2500-3000 Hz. The metal driver doesn’t break-up until 4000 Hz. Note how the paper break-up peaks are smaller and they coincide with the driver’s natural roll-off. The metal break-up peaks are bigger and the driver’s roll-off doesn’t begin until higher frequencies.
To further illustrate this, let’s look at a number of frequency response curves of a series of SEAS drivers of similar 6½” size but made with different cone materials. As you'll see below, these frequency response curves are all made with the same horizontal & vertical dimensions, allowing easy comparison among them. Pay close attention to the right side of these graphs, at 3000 Hz and higher, where roll-off and break-up modes appear.
Coated Paper –
CA18 RNX
Woven polypropylene –
U18 RNX/P
Reed-paper –
ER18 RNX
Aluminum –
L18 RCY/P
Magnesium Alloy coated with magnesium oxide –
W18 E001
Graphene treated magnesium –
W18 EX003
As the driver cones get stiffer, the break-up modes are shifted to the right, at progressively higher frequencies. This results in wider regions where the sound is flat, well behaved, and not affected by resonance or break-up.
Seas does not offer drivers with cones made of uncoated paper, fiberglass, Kevlar, coated or anodized aluminum, or ceramic.
From all this, I hope it's clear that different cone materials can offer the possibility of more detailed and less distorted sound, free of ugly sounding resonances. But they don't automatically guarantee better sound unless careful tweeter selection and crossover design is also done.