Hello all,
Thank you for taking a moment to take a look at this. I appreciate your time. I am new to measuring and trying to slowly creep into a little better understanding of how measuring works, what it represents and how to use it for room correction and/or a little equalization to correct for the room. I'm practicing in my office on a 2 channel setup, near field without a sub-woofer (I have one, but am not using it for this exercise yet, one step at a time) simply to get some experience doing this, using software and understanding it all. Any guidance or correction would be greatly appreciated! I have already read a few articles and tutorials and watched a few videos to at least try to have a better vocabulary and understand a bit more about what's going on, but I am not an engineer nor do I have any background in sound science other than being a life long audio-enthusiast (without golden ears though). I mainly do critical listening with headphones, have a stereo setup in my office and then my home theater. Most of this exercise is to help me understand what I'm doing when it comes to room correction and equalization when it comes to my home theater as I will be building a new home soon and will have a dedicated room for audio so I'm preparing for that (though it will not be a totally custom room, likely a garage converted to a finished room and then I can treat the inside but likely will not be able to control dimensions beyond a blueprint).
TL;DR: I'm trying to practice measuring my office and doing room correction equalization to understand how to read the graphs, understand what's happening in the room and how to potentially approach correcting the room or the equalization to get a flatter response as an exercise in an imperfect room with imperfect placement.
I have started with:
Polk Monitor 30 II Books x 2 via AudioSource AMP 100 & MaverickAudio TubeMagic D2
MiniDSP UMIK-1 with both calibration files
REW Software
Equilizer APO Software
My office!
Now, my office is by no means treated or even optimal for critical audio application. It's my work office and the placement of everything is limited, so I'm simply trying to use it as a good exercise to measure things, understand what it means, what the room is doing with the frequencies, overall performance in the room, what can be done to correct a little bit for the room, knowing its not optimal. It's also a small room and positioning is not optimal due to the layout of the office. Again, this is an exercise for me to simply understand and practice doing this. Any help understanding or correcting any interpretation would be excellent!
My office is 930 cubic feet in volume, 9'6" x 12'6" x 7'10" with a door and one window. The position of the speakers is not optimal due to layout of office. It's a near field setup basically in the right front corner of the room away from the door and window where my desk is.
Forgive this graph or any values, I'm trying to use the room simulator in REW to get an idea of things after I input values with my measurements:
I used the UMIK-1 to do some measurements in my listening position. I was reading that for
room correction it's potentially better to use a 90 degree position with the microphone with the 90 degree calibration file applied in REW to get an idea of the room perhaps a bit better than directly trying to measure the speakers themselves. This is something I'm not entirely clear on. I was trying to read more about best way to measure the output of the speaker frequency response and the room response in general as a whole and whether it's ideal to use the 0 degree or directly at the speaker position or the 90 degree (towards the ceiling) position of the microphone for best examples of what's truly going on and how to interpret that. Any help there is great!
My
initial measurements are the following in the room (I used REW and the UMIK1 to set my SPL to 75db via Pink Noise for this):
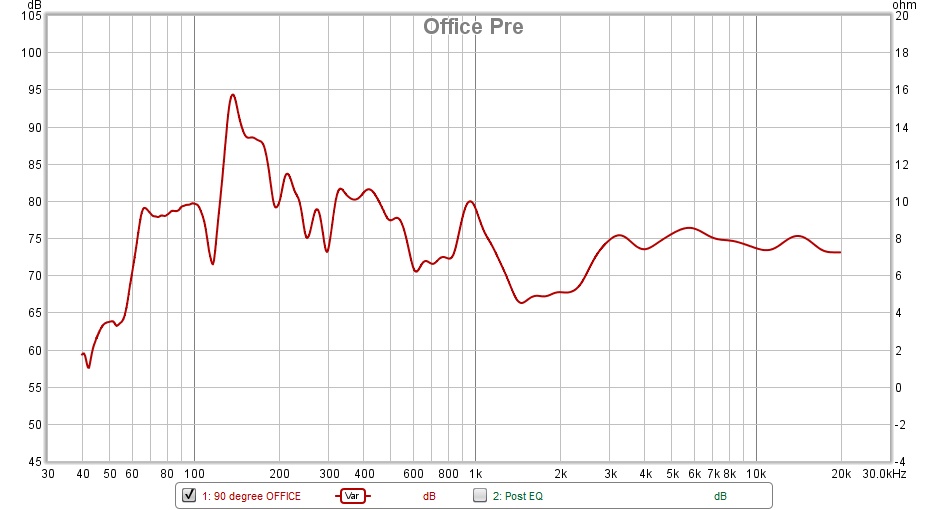
Trying to understand and interpret this (above) graph, it looks like my speakers are not going to have any meaningful output until around 60hz and rolls off sharply down to 40hz where it blends into ambient room level noise. I have some kind of trough around 110hz but it's only around 3 or 4 db so I assume this is normal and nothing to fuss with? However, there's a weird peak at 150hz give or take a bit, that really spikes high. Is this room reflection or room gain or something like this? The other frequencies going from there to around 1khz all seem to be on the higher side of where reference was and a 5db and 10db difference is pretty significant, so I assume this is something I would want to correct to be flatter in response. From 3khz on, it seems to be appropriate and fairly flat with minimal fluctuation, no more than 2db or so. So the question is, to correct this (for theory sake, knowing this room is not optimal for this) what kind of treatment ideas would one start to consider? Otherwise, beyond equalization, but if I were to think of doing anything physically to the room based on this graph, what approach would one take?
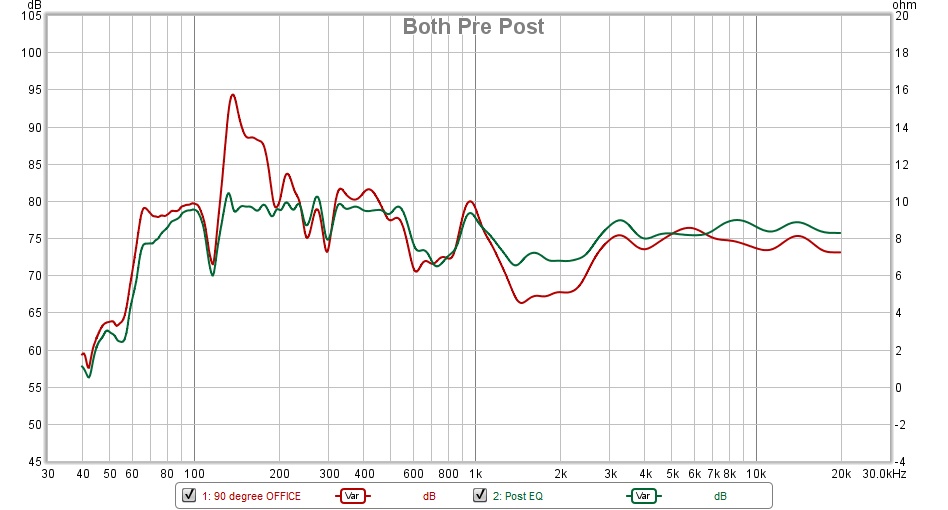
Next, I used this measurement and I applied a House Curve (not something completely flat, the Harman's approach I believe it is?) and then used EQ in REW to generate filters to try and correct for some of the big amplitude changes in the frequencies above. I saved this EQ set of filters and applied them via Equalizer APO. I then measured the response again in REW. The following two graphs are the new room frequency response after equalization and the final image are both overlapped to see the difference.
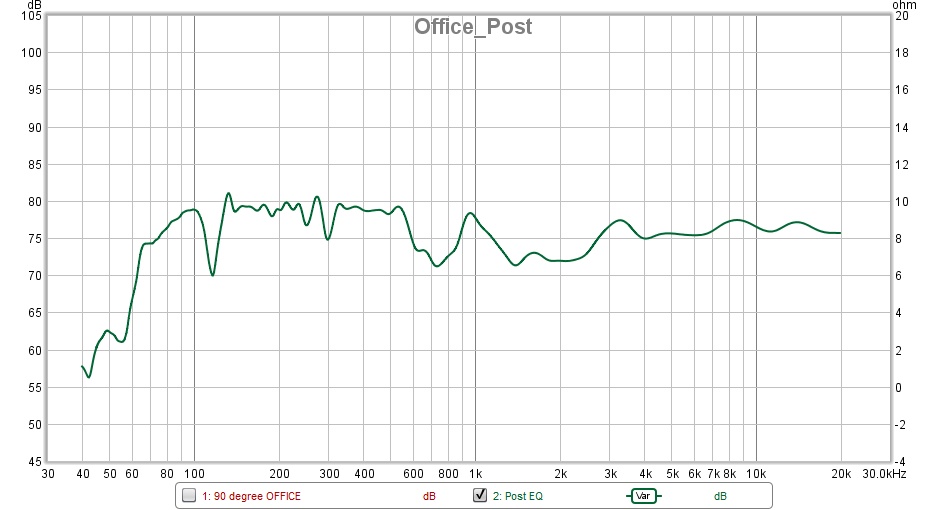
So to interpret the above changes to the new frequency response, it seems that the measurements and equalization made some positive changes towards a flat response in the room, so that would represent the room correction I think? The trough around 110hz is still present but is only around 5db in difference, as I read it was wise not to try to fix troughs by increasing their levels at that frequency (I'm not sure if that's true). The major peaks however are now gone completely and that entire stretch of frequencies from 150hz to 600hz is now much flatter and much closer to reference, with a few peaks that are noteworthy. But overall the response fluctuates much less and is closer to a flat response than it was at least. I am curious what may cause that large spike around 150hz however that was corrected significantly. Also, I'm curious, what would be the ideal way to approach that trough at 110hz, or is it fine like this? Not asking from a sound perception point of view, but more the idea of what I can be looking at in terms of the room to correct for, or equalization to address (if possible) without harming the overall response. Any guidance there would be appreciated!
If you got this far, thank you for taking the time to read through and any comments or help to understand the above would be greatly appreciated!
I would like to use anything learned from this process to better understand how to approach the same thing in a larger room with more control for a home theater (building new home, will have new dedicated room). Any tips on how to use the above to identify room correction or treatment or best ways to equalize, etc, would be awesome!
Very best,